
These pages are designed to support the MODELFEST activities associated with the contrast performance of the human eye. MODELFEST is a joint effort between the academic and industrial community to quantify the contrast performance of the human eye through standardized psychophysical testing. The effort began in 1996 with the results of the Phase 1 effort appearing in 1999. The current protocol and some test results are available at the above site.
While the MODELFEST activity has focussed on largely abstract empirical models of the contrast performance of the human visual system (HVS) so far (simple mathematical equations but sophisticated statistical analysis), these pages will focus on the more fundamental electrophysiological (theoretical) mechanisms of the HVS. This approach has surfaced a number of problems with the empirical approach. The most important of these is the fact the contrast sensitivity function(s) of the HVS are functions of the illumination level used to collect the experimental data.
One objective of the effort is to develop one or more theoretical models to correlate with the data. This document will present such a model and also recommend modifications to the current protocol. All of the data that is presented is the work of other members of the MODELFEST group or other documented sources. Paragraph numbers that appear within square brackets refer to Sections within the treatise PROCESSES IN BIOLOGICAL VISION. The first numeric gives the chapter number within the work. Individual chapters may be downloaded from the above site to locate complete references. A comprehensive compilation of the parameters of the STANDARDIZED HUMAN EYE is also available. This page is in beta release. The author welcomes and will respond to any comments or suggestions left at the comment page.
The main content of this page will be presented in the following order.
The following more detailed material is provided at the end of the document in support of the above material.
To place the MODELFEST activity in proper context within the field of vision, it is important to differentiate between the luminance contrast sensitivity of the system with respect to temporal frequency (CTF) and spatial frequency (CSF). Simultaneously, it is important to recognize the parallel chromatic contrast sensitivity as a function of temporal frequency (CCF). The literature has not always clearly differentiated between these functions. On this page, and in the supporting material [17.1.2.3 & 17.6.3], a clear distinction will be made between these functions. It is also important to recognize the difference between luminance contrast in object space and in electrophysiological space.
The upper half of the following figure illustrates the first level signal flow within the HVS. The illumination falls upon the three spectrally selective chromophores generating the S-, M- and L-channel spectral signals. These signals are connected to separate matrixing networks that create the P-, Q- and R-channel signals that are transmitted to the brain.
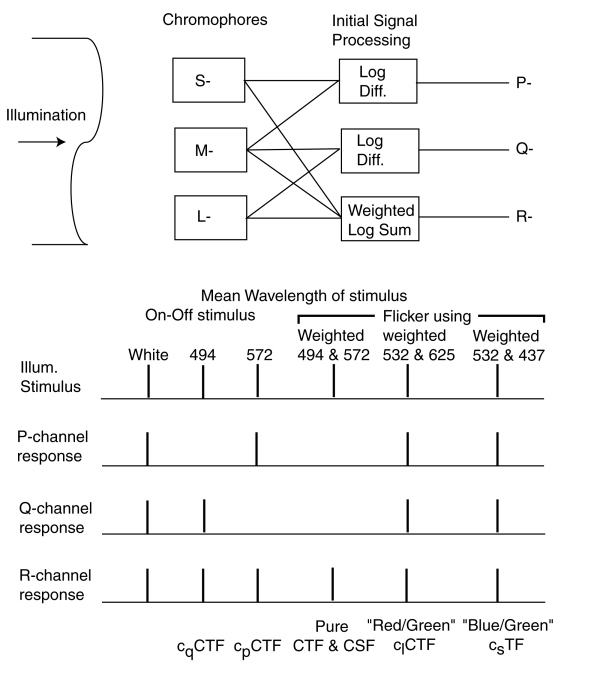
The R-channel luminance signal is created by summing the weighted logarithms of all three spectral channels, sLnS + mLnM +lLnL. The P- and Q-channel chrominance signals are created by taking the difference in the logarithms of pairs of spectral channels, LnM - LnL and LnM - LnS.
The magnitude of each of the spectral signals is determined by the net number of photons absorbed (not by the net energy absorbed) by each chromophore. Because of the large amount of overlap between the absorption spectra of the chromophores, each signal difference exhibit a null at a specific wavelength, nominally 494 nm for the short wavelength difference and 572 nm for the long wavelength difference. The precise wavelengths of these nulls can be verified by scanning the visual spectrum with a very narrow bandwidth illumination source.
The lower half of the above figure illustrates the signals generated when the illumination is tailored in specific ways (without regard to polarity). If the input is a spectrally uncontrolled flashing "white" light, the contrast associated with this signal creates a contrast signal in each of the output channels. The signal in the R-channel is defined as a contrast versus temporal frequency (CTF) function. Chromatic contrast versus temporal frequency functions are also created in both the P- and Q-channels. These can be defined as CCFP and CCFQ signals.
By carefully selecting the spectral content of the illuminating stimulus, it is possible to separate the CTF, CCFP and CCFQ functions. If the mean wavelength of the excitation is 494 nm, no contrast signal will be generated in the P-channel. If the mean wavelength of the excitation is 572 nm, no contrast signal will be generated in the Q-channel. By tailoring the short and long wavelength segments of the excitation to have means of 494 and 572 nm, the only contrast signal generated will be in the lumiance or R-channel. This will generate a pure CTF (or CSF) signal.
Alternately, by using a properly weighted signal flickering between 532 and 625 nm, a pure CCF signal can be generated since the apparent illuminance of the stimulus will remain fixed. The last two wavelengths are compatible with the common "red"-"green" flicker tests. This stimulus can be further tailored (using the New Chromaticity Diagram for Research) to only generate a CCFP or CCFQ contrast signal.
The spatial performance of the visual system is closely linked to the temporal performance. A simple conversion factor, having the units of angular velocity can be used to transition between these two domains.
The threshold contrast as a function of frequency can be determined by solving an equality that is the same as that used in photography and image transmission systems. This equality is defined at the point of signal perception (in this case, in the midbrain) and given below in two forms.
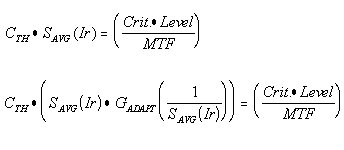
In the first form, the product of the contrast threshold (CTH)multiplied by the average amplitude of the signal in the signal chain SAVG(Ir) as a result of a specific irradiance level (Ir) is equal to the product of the threshold level (Level) times the perception criteria (Crit.) divided by the cumulative modulation transfer function (MTF) of all circuits in the signal chain. The criteria is a function of the geometry of the imaged stimulus. The threshold level may be deterministic or stochastic depending on the intensity of the irradiance. In this form, the contrast threshold is inversely proportional to average signal level at the point of perception.
In the second form, the signal level is expressed as the signal level created in a chromophore due to an incident irradiance SAVG(Ir). This expression is multiplied times an amplification factor associated with the adaptation process, GADAPT (1/SAVG(Ir)) In this expression, the gain (G) is inversely proportional to the incident irradiance. Over the operating range of the adaptation process, the product of the incident irradiance and the gain of the adaptation process is a constant. This range is defined as the photopic region of vision.
By solving the above expressions for the contrast as a function of frequency, either of the following two graphs can be used. The one on the right is found most commonly.
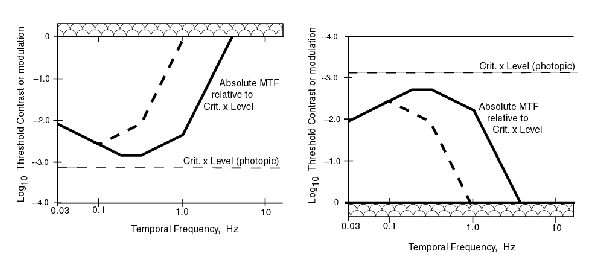
In these figures, the 100% contrast level is shown by a broad bar since, by definition, it cannot be exceeded. The light dashed line shows the contrast threshold in the absence of any MTF function associated with the bandwidths of the individual circuits of the signal chain. The heavy dashed line shows a change in the MTF due to a change in one of the terms used in computing the the overall MTF.
It is common to report the results of threshold contrast performance in either the temporal domain or the spatial domain because that is the way the data is usually collected, e. g., by determining the reported threshold level while using stimuli that vary in either temporal or spatial frequency.
The threshold contrast performance of the human visual system can be described using a slightly more complex concept of modulation transfer functions than defined above. The approach is the same as that used in image transmission systems that involve a series of MTF's. This function describes the response of a given parameter as a function of spatial or temporal frequency. There are four primary elements in the visual system that exhibit MTF's. (See Section 3 of the supporting documentation at the end of this page.) The first is the lens group within Stage 0 (the physiological optics). The second is the Photoexcitation/De-excitation mechanism within the Outer Segments of the photoreceptors, or PC's of Stage 1. The third is the adaptation amplifier within Stage 2. The third is the integrator associated with the demodulator associated with the signal projection circuits within Stage 3.
The equation for the composite MTF of the visual system is given in the following figure. It is the product of the individual MTF's which are each described using the notation of Network Theory. Most of the terms are of the form 1/(S + jSX)and they describe a low pass filter. Three terms are different. The Stage 0 term, shown by the red dotted lines, is of a form peculiar to physical optics. The location of SL, and therefore the slope of the lines can vary significantly due to defocus. The Stage 2 term is peculiar to the adaptation process of the PC's. The form S/(S + jSX)describes a high pass filter (with zero response at zero frequency). The second term of Stage 1 introduces a critical factor in understanding the contrast p erformance of the visual system. One of the two variables in this MTF is a function of the illumination level, I, of the stimulus. Note the significant variation in the spatial frequency of S(I)P2 due to this fact and shown by the black dotted lines.
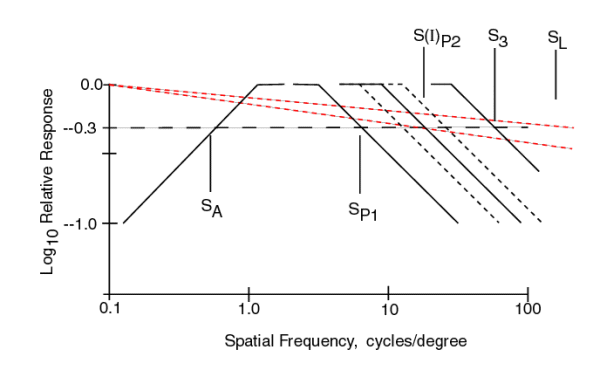
The graph in the figure shows each of these individual MTF's plotted as a function of spatial frequency using two asymptotes to describe each function. Note that all but the MTF due to the optics show a one decade per decade slope beyond their half amplitude point. When such MTF's are multiplied together, their slopes add when plotted on logarithmic scales. In the following figure, the product of these MTF's is shown.
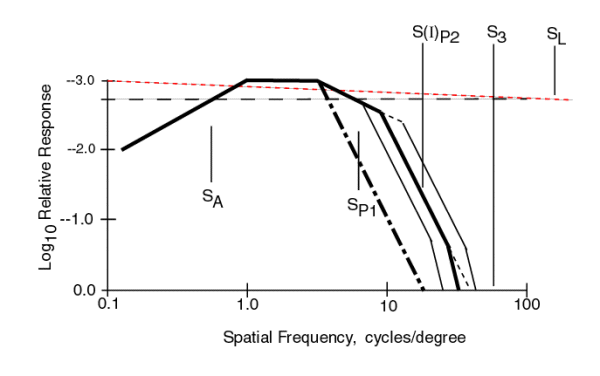
The effect of the optical system (the red dotted line) has not been multiplied into the product of the other MTF's although its effect can be readily seen. It tilts the overall graph down to the right. The dark solid line represents the product of all of the other MTF's. Although all of the parameters have the same value as in the previous figure, they are harder to recognize in this figure. Note the light lines to either side of the heavy line representing different values of S(I)P2. A special case occurs when the values SP1 and S(I)P2 are equal. The result is the heavy dash dot line.
It is the heavy solid and dash-dot lines that are characteristic of real human contrast thresholds. These lines are shown over a range of 1000:1 in amplitude. This is more than the typical range of photopic vision in humans.
The break in the low frequency response of human vision is frequently seen in the literature but seldom addressed. It is due to the high pass filter characeristic of the adaptation process in vision.
Unless a carefully tailored light source is used, contrast sensitivity experiments will cause the perception of both a chromatic and a luminance change in the stimulus. The subject in a psychophysical experiment is unable to distinguish between a chromatic perception and a luminance perception due to the same stimulus near the threshold level of stimulation. Therefore, the normally reported response to a stimulus change is the result of pooling (probably an absolute summation) of the individual responses. However, the chromatic contrast response normally peaks at a much lower frequency (temporal or spatial) than does the luminance contrast response. Thus the form of the data usually reported in the literature is a mixture of the CCF and CTF (or CSF) responses of the subject. This appears to be the case in most of the Phase 1 MODELFEST data.
The above MODEL provides an excellent fit to the Phase 1 database collected at 30 Trolands nominal illumination. It can be fit to the traces for individuals or to the statistics of the data set.
The following figure shows the MODEL fitted to the Fixed Size data from Phase 1 without including any MTF for the physiological optics. The direction of the relative scale on the ordinate has been reversed to conform to this theory.
Even the asymptotic form of the model passes through all of the data range bars. The actual response would always be on the low side of the asymptotes and would fit even better.
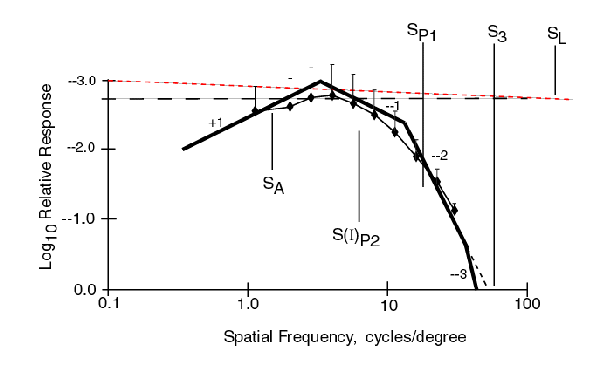
The following figure shows the MODEL fitted to the Fixed Cycle data from Phase 1 without including any MTF for the physiological optics. The same asymptotic form of the model as used above is also a good fit to the data except at the lowest frequency. The horizontal trend in the data at the lowest frequencies suggests contamination by the subjects response to chrominance contrast in addition to luminance contrast in this region.
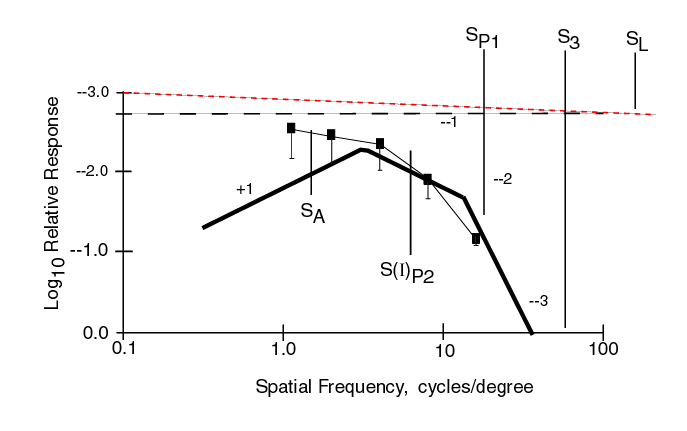
Both data sets only extend over a dynamic range of less than 100:1 as expected. Because of this, the steepest negative slope is -2. Neither data set shows any impact of Stage 3 signal processing. Nominal values were initially set at SA = 0.4 c/d, SP1 = 6.0 c/d and S(I)P2 = 20.0 c/d in the example. However, at the low illumination level used in the MODELFEST experiments, 30 cd/m2, SP1 is at a higher frequency than S(I)P2. It appears SP1 = 18.0 c/d and S(I)P2 = 6.0 c/d are appropriate values from the data.
When looking at the reported dataset from an individual, it is important to look for a component in the waveform with a slope of -1. The datasets can be divided into groups based on this criteria.
It is also important to look for the presence of a slope of +1 in the waveform. This parameter is a coarse indication of the health of the retina. However, this slope usually occurs at below 1.0 HZ and may be difficult to measure.
A very informative figure results if the data from the MODELFEST is combined with the data from Kelly & van Norren. They provided similar data at a higher illumination level of 860 Trolands.
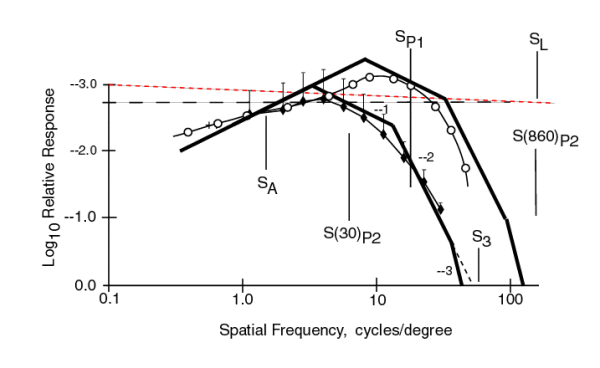
All of the parameters related to the asymptotes remain unchanged except the value of S(I)P2 now takes on two separate values as indicated due to the difference in illumination level. Whereas S(30)P2 had a value smaller than SP1, the value of S(860)P2 is larger than SP1. This change causes the first break in the +1 slope to occur at a higher frequency and that break to be cause by SP1. The second break is now due to S3 and the third break is now due to S(860)P2. The peak in the contrast threshold (most sensitive value) is higher for the Kelly data (as expected at higher light levels). It also occurs near 10 c/d rather than the 2.97 c/d of the MODELFEST data. The 100% contrast limit of 0.0 on the ordinate remains unchanged.
The model illustrated above and detailed below contains no free variables. All parameters are directly relatable to the parameters and actual mechanisms of vision. The version developed here is limited to the photopic regime of vision. It is a simplification of the model applicable to the mesopic and scotopic regimes as well[17.7]
When there is sufficient accuracy in the dataset associated with a single individual, the model can be used to define the parameters associated with that specific individual with excellent precision. These values can be compared to the nominal set in the Standardized Human Eye or used to evaluate the health of the individual.
Given more precise data (shorter range bars), the equations of the MODEL can be plotted more precisely also. This will allow an even finer determination of the parameters of the eye related to contrast sensitivity.
If it is desirable to create an abstract mathematical model describing the CSF performance of the visual system, a skewed hyperbola offers a good choice. The hyperbola approaches two straight lines (directors) as asymptotes. In this case, an asymptote with a slope of +1 can be used at low frequency and an asymptote with a slope of -3 can be used at high frequency to approximate the envelope of the data over the photopic range. The high frequency asymptote does need to be a function of illumination level in the frequency range from about 2 to 50 c/d. The use of a hyperbola provides a better description of the envelope than a parabola since a parabola suggests higher and higher slopes at large distances from the director. In either case, the functions are only applicable for contrast values of less than 100%.
An equally abstract description of the asymptote to the CSF can be obtained by using another function found in the vision literature, the DOG or difference of Gaussians function. This function exhibits a +1 slope at low spatial frequencies and has a very steeply falling slope at high spatial frequencies when plotted using logarithmic scales. The peak moves as a function of spatial frequency in accordance with the ratio of the two standard deviations of the DOG function while maintaining a +1 slope on the low frequency skirt[17.6.3.4.1].
The protocol used during Phase 1 of the program can be improved in preparation for Phase 2. The following list and comments are presented for discussion within the MODELFEST group. It is expected that additional comments or footnotes are appropriate.
| Parameter | Protocol 1 Specification | Recommended Specification | Comment |
|---|---|---|---|
| Spectral Filter | --- | Wratten 55 or Edmund H46139 | ** See note |
| Mean luminance | 30±5 cd/m2 | 30±0 cd/m2 | Raise precision, let test instruments determine accuracy |
| Frame rate | >=60 Hz | >=60 HZ noninterlaced | Preferred |
| Raster line pitch | 120 lines/degree | less than 0.5 minutes of arc | Specified in angular measure |
| Phosphor type | P104, blue-green "white" | ** See note | Generates considerable chromatic contrast mixed with spatial contrast |
| Phosphor decay | 0.1 ms to 10% | Negligible impact on contrast, see Watson | |
| Grayscale resolution | <0.25 threshold | ||
| Procedure | 2IFC or ? | ||
| Viewing | Binocular | ||
| Pupils | Natural | Artificial, fixed | Preferred to control illuminance & lens MTF |
| Accommodation | --- | 20 min. | Minimum @ avg. test luminance before test |
| Image size | 256 x 256 pixels | 0.5 x 0.5 degrees | Specify stimulus size in angular measure |
| Fixation | --- | Centered on stimulus | |
| Fixation aids | 2 x 12 pixel L | 4 L's with 2 x 12 pixel legs | Crop marks framing the 0.5 x 0.5 degree field, always on |
| Surround level | --- | Mean luminance | Eliminate uncontrolled variable |
| Time course of stimulus * | Gaussian, 0.5 sec total, 0.125 sec s.d. | Square, 0.5 sec duration, gated by frame rate | Avoid interference with perception mechanism |
| Feedback | Provided | ||
| Meas. Contrast Accuracy | 0.1 log units | ||
| Meas. Threshold Accuracy | 84% correct point |
* The recommended change in the time course of the protocol is to recognize that the eye may employ several motions during the nominal 0.5 second interval. Assuming the eye is already gazing at the nominal centroid of the stimuli (It is a major assumption that the eye is already looking at the point in the image that the midbrain believes is most important), the eye will probably still make two small saccades and about 6 minisaccades (flicks) during the subsequent 0.5 seconds of the test. This subject is discussed further with reference to reading.
** The use of a single phosphor CRT cannot provide sufficient control of the stimulus to obtain pure CSF, CTF or CCF data. Either a carefully filtered tricolor CRT or separate spectral sources of illumination are needed.
A comprehensive program has been developed in a collegial environment to quantify the threshold contrast sensitivity of the foveola of the human eye as a function of spatial frequency. The program uses a standard set of stimuli and a protocol to aid in the accumulation of consistent results compatible with a theoretical model of the underlying mechanisms.
The Phase 1 effort is focused on using a broad set of identical GaborPatches, sinusoidal bar patterns in one and two dimensions and several orientations, within a group of laboratories in order to obtain a more consistent database.
The Phase 1 effort has employed a simple protocol to aid in achieving consistent results. However, the protocol has been derived based on practical and experimental convenience. It can probably be improved based on firmer theoretical requirements.
A complete discussion of the protocol for the program is available as a PDF document.
This site develops a theoretical framework in which to view the data based on the actual electrophysiology of the human visual system (HVS). The theoretical model of the underlying mechanisms is abstracted from a more complete model available in the treatise, PROCESSES IN BIOLOGICAL VISION.
A fundamental foundation for the effort defined in the original MODELFEST activity is that the HVS can be modeled as consisting of four stages: conversion from luminance to contrast, spatial filtering by a contrast sensitivity function (CSF), a linear (channel transform, and pooling of transform coefficients to yield a single number that is assumed to be constant at detection threshold. (See page 9 of above Watson paper.) Although this rationale may aid in some application engineering, it does not appear to be consistent with the electrophysiology of the HVS. It appears to contain to many arbitrary assumptions.
A broader framework for discussing the threshold contrast in vision is the same as used in the photographic and image transmission fields. The basic question is: what level of contrast is required to achieve recognition of a given image or class of images projected onto the photon sensitive surface at a specific scale? The solution is to derive the signal-to-threshold condition for the system as a function of the type of the target stimulus. There are three typical stimuli types in imaging systems. The stimuli can be a natural scene, a symbolic scene or a totally abstract scene. A natural scene can be as simple as a path or as complex as a face. A symbolic scene is typically a pictograph or one or more characters of the character set of a language. Examples of totally abstract scene are the USAF 1951 tribar resolution target, the Landout C, the Snellen acuity charts and the Gabor patch images. Each of these types of images exhibits a different signal to threshold requirement. The difference between them is small relative to the total instantaneous dynamic range of the visual system, typically 125:1.
The visual system employs a variety of information processing paths [15.2.4.3]. They include:
The physiological details related to each of the above paths are available [15.2.3 & 4]. Many of the physiological elements are shared between the various paths of the visual system. However, it is the analytical path that is of imediate interest. The major stages of the visual system supporting the analytical path include [11.1.3.2]:
The following modified Figure shows the major processing elements relative to the problem at hand. The luminance of the stimulus is shown on the left. The light passes through the optical system of Stage 0 and is brought to a focus to the right of the outer limiting membrane (OLM) and within the individual outer segments (OS) of Stage 1. The chromophores of the OS select only the irradiance applicable to their channel from the overall illuminance. It is the total integrated flux in this limited spectral range that determines the performance level of each spectral channel. The spectral signal generated in the OS is transferred to the associated adaptation amplifier within the inner segment (IS) of Stage 2. From there, the signal passes through the remainder of the signal processing of Stage 2 and is delivered to the ganglion cells at the entance to Stage 3. It is the signals generated and transmitted along the optic nerve of Stage 3 that are peceived, interpreted and ultimately recognized within the brain of Stage 4.
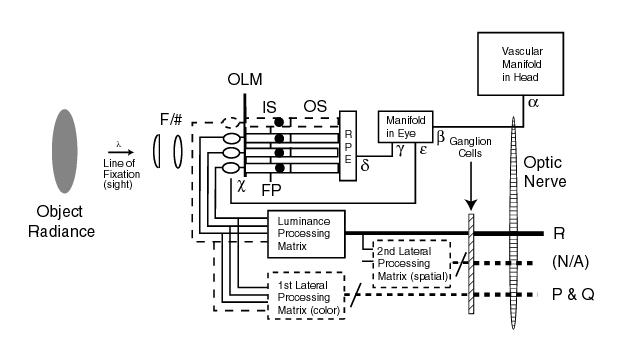
The original MODELFEST activities made the assumption that an achromatic image in object space was processes as an achromatic signal in electrophysiological space. By making this assumption, any processing in the 1st (chromatic) and 2nd signal processing functions were ignored. It was assumed that only the signal labeled R was processed by the HVS. The actual situation is discussed in Section 1 at the opening of this document. Three distinct contrast signals are generated within the HVS.
The vascular manifold is shown in the figure because of its importance in determining the low frequency temporal performance of the visual system. It is particularly important in the operation of the adaptation amplifier of Stage 2.
Each of the major elements shown in the above figure play an important role in determining the threshold contrast performance of the visual system. Each will be discussed below. To describe the spatial performance, it is important to recognize two situations. First, the visual system relies upon the tremor of the eye during a gaze (frequently but misleadingly called a fixation) to convert spatial frequency information into temporal frequency information for further processing. In the absence of tremor, the visual system is blind! Second, the description of the MTF's of the temporal signal channels requires the use of complex algebra, the primary language of Network Theory. This language allows all of the appropriate performance parameters of each functional element to be described in a consistent way.
The image source is shown explicitly in the above figure because it determines to a large extent the operating regime of the visual system. The image must be of sufficient luminance to establish the photopic visual range or a more complex model must be assumed. It must also be free of any dynamic elements in the temporal or spatial frequency range that might interfere with the data collection and analysis program. This condition is a function of both the source (frequently a CRT monitor) and the brain (particularly the time constant of the Stage 3 circuits. As an example, Watson has explored the phosphor decay characteristics of a particular monochrome monitor and how they impact the performance of the eye along the direction the flying spot. A similar analysis of the visual system would demonstrate that it is important to hold the stimulus fixed in both space and time for the duration of the stimuli interval since the eye may perform minor saccades between gazes during that interval. This is particularly true with respect to complex spatial patterns.
As will be addressed under the photodetection section, the spectral content of the source and scene (in the case of reflective illumination) play a major role in the contrast performance of the visual system. This performance can be impacted by the spectral content of the luminance.
Since only the performance of the visual system near the fixation point is involved in this program, the physiological optics can be considered to be diffraction limited at the resolutions of interest. The pupil size is an important parameter in determining both the MTF of the system and the irradiance applied to the photoreceptors. The diffraction limit (60-250 cycles/degree depending on pupil size) is at sufficiently high frequency to be of minor importance in these studies. During Phase 1, the use of a natural pupil was selected for the protocol. This may not have been the best choice. First, although not stated in the initial protocol, any defocus in the eyes of the subjects will degrade the performance achieved. Each subject should only be tested after correction of any vision errors to 20/20. Second, the square of the pupil diameter plays a major role in determining the actual illuminance achieved at the surface of the retina because it is a major determinant of the F/# of the optical system. Third, the age of the subject may impact the experiment if the luminance is heavily weighted toward the blue, where absorption of the lenses becomes significant. It is the illuminance of the retina, not the luminance of the source, that is the factor controlling visual performance. Details relative to the human optical system are available [2.3 through 2.3.8.4].
The signal detection stage of the visual system is unique to biological vision. The Outer Segments of the PC's use a closed loop Photoexcitation/De-excitation (P/D) mechanism that has not been discussed previously in the literature [16.3.5.1 and Appendix A]. The unique characteristic of this mechanism is that it includes two time constants and one of them is a variable as a function of the incident irradiation. This variable time constant is responsible for the primary variation in the contrast threshold characteristics that have been measured in the past, including during this MODELFEST Phase 1 activity. The second time constant is a function of the irradiance of the stimulus on the retina and is therefore proportional to the square of the pupil diameter. Both variations in luminance and pupil diameter contribute to this variable.
The word irradiance is used in the above paragraph because each spectrally selective photoreceptor only responds to the incident illumination within its spectral band. These detectors are quantum mechanical detectors (technically of the photoemissive, not photoconductive, type). They are responsive to the photon flux applied, not to the energy applied, to them within their spectrally selective bandwidth.
The spectrum of the illumination used during (at least part of) Phase 1 was skewed toward the blue (color temperature recorded as 7526 Kelvin). This caused a lower sensitivity spectral channel to be tested and probably led to a lower than maximum dynamic range in the data. A more optimum situation would be to tailor the incident radiation on the retina to match the spectral absorption of the M-channel (yellow-green centered on 532 nm)photoreceptors [17.2.2]. This can be done easily using a dichroic filter available from Edmund Scientific or a common gelatin filter. Using a filter centered on 532 nm also avoids a potential sensitivity variation due to the Brezold-Brucke effect [also 17.2.2]. This effect can introduce a variation in amplitude performance as large as ±15%.
While measuring the irradiance of the retina is awkward, this irradiance can be calculated with precision by measuring the irradiance at the position of the pupil and knowing the diameter of the pupil as well as any absorption factor for the lens group. Without knowledge of the pupil diameter, an error of ±15% can be expected, particularly in the threshold value at high frequncies.
By concentrating on "black and white" stimuli, the effects of most of the complex signal processing of the visual system were largely eliminated from the Phase 1 study.
The initial signal processing occurring within each PC is a critically important element in the model of contrast threshold performance. The adaptation amplifier is located in the inner segment (IS) of each photoreceptor. These amplifiers operate quasi-independently but are supplied by a common power network that introduces many edge effects when processing high contrast material. The circuit of each adaptation amplifier is highly tailored to provide color and "luminance" constancy over a very wide dynamic range [17.4.5]. These amplifiers exhibit several time constants that are important in threshold contrast experiments [12.5.3]. The principle time constant has a value of about three seconds in the health eye. Since this time constant appears in a feedback "loop," it introduces a high pass filter into the signal path. This time constant is responsible for the limited low frequency performance of the visual system that appears in contrast versus frequency studies. There are also time constants of 2 minutes and ten minutes associated with large scale changes in illumination level. Although potentially unimportant in these studies, the data in the literature can be sorted to highlight the subject who spent the morning at the beach or is partially snow-blind from sking over the weekend. It is suggested that subjects be screened for such activities if a potential problem. A 20 minute pre-experiment adaptation period at the nominal illuminance of the experiment should be considered minimal for precision work. By adapting to the color temperature of the experiments, variations due to the Brezold-Brucke Effect can be minimized [17.2.2].
In the visual system, the signal-to-threshold condition can be defined in terms of the product of the signal level times the contrast times the product of all of the modulation transfer functions (MTF's) of the system up to the point of recognition divided by the threshold level of the system multiplied by the specific signal to threshold requirement for the type of image used.

The MTF's are the only expressions that are a function of spatial frequency. The dynamic range of the individual spectral channels of the visual system are largely independent of illuminance within the Photopic regime. However, it appears the M-channel (yellow-green centered on 532 nm) has the highest dynamic range.
By evaluating this equation against a database, the values of the individual parameters can be determined. This has been done in the earlier part of this page.
All MTF's but the MTF for the optics exist in the temporal domain. To be useful in contrast threshold measurements, they must be converted to the spatial domain. This is accomplished using a conversion factor representing the nominal unidirectional velocity of the tremor mechanism.
The electrical frequency parameters are determined from the RC time constants of the various mechanisms of each stage. The formula for RC networks is F1/2 = 1/pT.
The time constants for the human visual system are poorly known because of the limitations on invasive measurements. The best values for the Stage 1 time constants are probably from electroretinograph measurements of the Class A waveform (also known as the a-wave) [11.1.5]. The best estimate of the Stage 2 time constant is from careful study of the complete dark adaptation characteristic [16.3.5 & 17.2.2].
| Stage | Parameter | Time Constant, sec. | Temporal Frequency, Hz | Spatial Frequency, c/d |
|---|---|---|---|---|
| Stage 0 | SL | --- | --- | 60-250 |
| Stage 1 | SP1 | 0.02 | 16 | 18 |
| Stage 1 | S(30)P2 | 0.06 | 5 | 6 |
| Stage 1 | S(860)P2 | 0.0023 | 140 | 168 |
| Stage 2 | SA | 3.0 | 0.1(nom) | |
| Stage 3 | S3 | 0.033(nom.) | 10(est.) |
* The value of 0.9 deg/sec. is equivalent to 32 arc sec tremor amplitude at 100 Hz which are typical tremor parameters.
the Stage 3 value is primarily a placeholder. It refers to the time constant of the integrator in the decoder of the projection stage and is related to the flicker fusion frequency of vision. The half amplitude value of 10 Hz is in general agreement with the data in Wyszecki & Stiles (1972), pages 557-567.