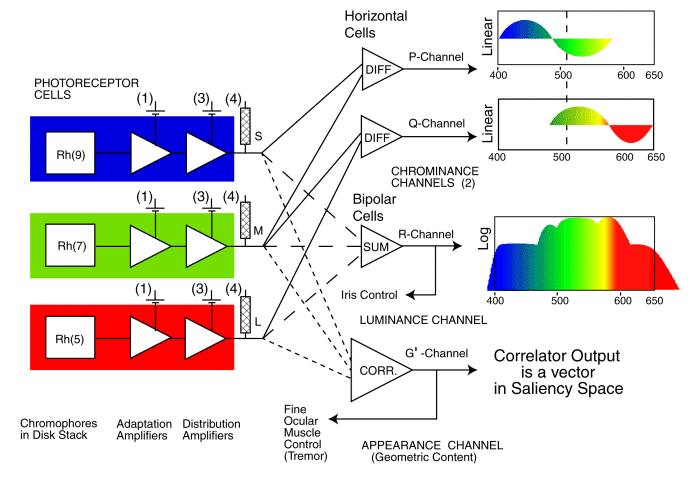
The signaling architecture of the visual system used in long wavelength trichromats (humans and other large terrestrial mammals) is shown in the following figure. This figure emphasizes the three distinct signaling paths found in vision (the P-, Q- and R-channels) as well as the unique correlation channel (labeled the G'-channel) found in only the highest primates (hominoidea) and used by the analytical mode of vision for reading and other functions requiring maximum acuity and perception of detail.

All of the relevant features of this figure are discussed, or referenced, in Chapter 17 of PROCESSES IN BIOLOGICAL VISION that is available for downloading as a PDF document Only a sampling of that information is presented below.
The numerical majority of the signal paths within the visual system involve signal differencing rather than summation. The performance of the chrominance system of vision cannot be described in terms of additive color principles. Only the luminance channel can be described using additive color principles. The chrominance channels use a modified form of subtractive color following integration with respect to wavelength. In both cases the spectral signals, S-, M- and L-, are converted to logarithms before algebraic manipulation.
The central channel, R, represents the luminance channel of vision. This channel is used to acquire the maximum amount of signal information without regard to its chromatic characteristics. However, the overall sensitivity of the channel is usually plotted as a function of wavelength as indicated on the right. The signals are summed logarithmically. The sample figure shown is more complex than the typical luminous efficiency function because it highlights two "ears" not usually found in smoothed variants of this function such as the CIE (1931) version which was effectively filtered by a 30 nm window ( the performance of the spectrographs used at that time). These ears are located at 487 nm, the Brezold-Brucke Effect, and at 579 nm, the Purkinje Peak. They are artifacts of the logarithmic summing process. They do not represent actual peaks in the sensitivities of the individual chromophores. The nominal peaks of the three chromophores of trichromatic vision are at 437, 532 & 625 nm.
The Purkinje Peak at 579 nm is frequently reported as the peak absorption wavelength of the L-channel chromophore by psychophysicists who attempt to bleach the M-channel chromophores before performing their experiments. If the effectiveness of the bleaching is sufficient to reduce the absorption coefficient of the M-channel chromophores by between a factor of 10 and a factor of 1000, the Purkinje peak becomes the dominant feature in the overall absorption spectrum obtained by psychophysics experiments. [17.2.2.5.1]
The system uses two distinct chromatic channels, labeled P- and Q-. As suggested by James C. Maxwell in the late 19th Century, the perception of color is “a mental science.” The brain essentially divides the visual spectrum into two distinct segments. It creates one electrotonic (analog) chromatic signal (the P-channel signal) by taking the difference between the S-channel and the M-channel signals in logarithmic space. It creates the second electrotonic (analog) chromatic signal (the Q-signal) by taking the difference between the L-channel and the M-channel signals in logarithmic space.
The existance of these two distinct signals is the key to understanding color blindness. A failure in the Q-channel is the cause of what is described in this work as intrinsic deutranopia.
These two signals (P- & Q- ) are treated as if they were orthogonal in the visual signal processing system. As a result the apparent color space of trichromatic vision is two dimensional. This color space is displayed in the New Chromaticity Diagram for Research. Notice that this New Diagram is rectilinear and does not employ any empirical approximations such as x,y or u,v used in the older CIE Diagram.
All of the signal processing shown in the figure occurs within the retina except for that shown at the bottom right. The signals from the individual photoreceptors of the foveola are transmitted to the Precision Optical System (POS)of the midbrain for correlation as shown. This correlation process is a key to human vision. It is a two dimensional process involving about 23,000 individual input signals simultaneously. The outputs of this correlation process are vectors (as opposed to retinographically oriented signals). One signal, the G' signal, is transmitted directly to area 7 of the cortex (without passing through area 17)[Chapter 15]. The other signal is used to control the oculomotor muscles of the eyes [Chapter 7].
The importance of servomechanism feedback in vision is emphasized by the feedback paths shown at the lower right and labeled "iris control" and "fine ocular muscle control".
The labels shown below individual boxes are those generally associated with the function in the literature. However, the internal elements of the photoreceptor cells are shown in more detail than in the general literature.
The labels within the individual boxes labeled "chromophores in Disk Stack" refer to the specific chromophores of vision described in Chapter 5.
The individual adaptation amplifiers within each photoreceptor in each spectral channel should be noted. They are described more completely in Chapter 12.
The complete discussion of this figure is found in Chapter 17 for normal vision and in Chapter 18 in regard to abnormal chromatic vision. The figure is particularly important in understanding the serious medical syndrome of achromatopsia.
Return to the website home page