There are two fundamental questions in the field of abnormal color vision. The first is always "DO I HAVE NORMAL COLOR VISION? The second is always "WHAT DOES A COLOR BLIND PERSON SEE?
There are many simple tests designed to answer the first question. Most of them have been designed to evaluate industrial workers. Click here to take such a simple test
In the past, a satisfactory answer could not be given to the second question. However, based on the theory presented in PROCESSES IN ANIMAL VISION, an answer can now be given. The following figures, from Chapter 18, provide a simple answer to this question for purposes of general education.
THE FOLLOWING FIGURES ARE NOT RENDERED WITH SUFFICIENT ACCURACY TO BE USED FOR DIAGNOSTICS. THE AUTHOR HAS AVAILABLE MORE PRECISE CHARTS. YOU MAY CONTACT HIM VIA THE COMMENTS PAGE OF THIS WEBSITE.
When rendered properly, a complete duetranope or tetartanope should not be able to distinguish these figures from the complete full color rendition of the Chromaticity Diagram found in Chapter 18.The author would appreciate hearing from anyone with significantly impaired color vision. A brief description of their condition would be helpful.
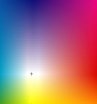
Using an accurately reproduced set of the following charts and the NEW CHROMATICITY DIAGRAM FOR RESEARCH (note the small version in the upper left), it is easy to compare the chromatic performance of the normal and abnormal subject. It is more difficult to evaluate color abnormals using the CIE Diagram because of the gross curvatures involved. The CIE u,v Diagram is better but less widely used. This newer Diagram is still not orthogonal.
The scales shown outside the following figures are for a Nagel Anomaloscope (Type II) with specially selected primary and test light wavelengths as indicated. Other wavelengths are normally used but do not change the overall presentation.
It is useful to note that the deutranope and tetartanope both exhibit normal spectral absorption characteristics. All of their photoreceptors are working normally. Only the much more uncommon protanopes and tritanopes suffer from a loss of sensitivity with respect to one of their groups of spectrally selective photoreceptors.
The following figure presents both the orthogonal New Chromaticity Diagram for Research and the CIE Chromaticity Diagram (1931) as seen by a complete deutranope.
The complete deutranope suffers from a complete failure of the P-channel of the visual system. As a result, he can not evaluate and perceive information normally provided by that channel.
This figure shows how a deutranope sees all blues, violets and magentas as shades of violet and all shades of dark green, yellow, orange through some reds as yellow. He sees a range of colors from aqua (blue-green)through a range of red hues, and white as white.
Protanopes see a Chromaticity Diagram similar to that of the deutranopes except their vision fades to gray at wavelengths longer than 600 nm. This value is shown as the dash dot line on the New Diagram and as the squiggly line on the CIE Diagram.
The following figure presents both the orthogonal New Chromaticity Diagram for Research and the CIE Chromaticity Diagram (1931) as seen by a complete tetartanope.
The complete tetartanope suffers from a complete failure of the Q-channel of the visual system. As a result, he can not evaluate and perceive information normally provided by that channel.
The figure below shows how a TETARTANOPE sees all oranges, reds and magentas as shades of red and all shades of dark green, aqua and blue as aqua (bluish green). He sees yellow, white and a range of violet hues, as white.
Tritanopes see a Chromaticity Diagram similar to that of the tetartanopes except their vision fades to gray at wavelengths shorter than 460 nm. This value is shown as the dash dot line on the New Diagram and as the squiggly line on the CIE Diagram.